"""
What are SaaS metrics?
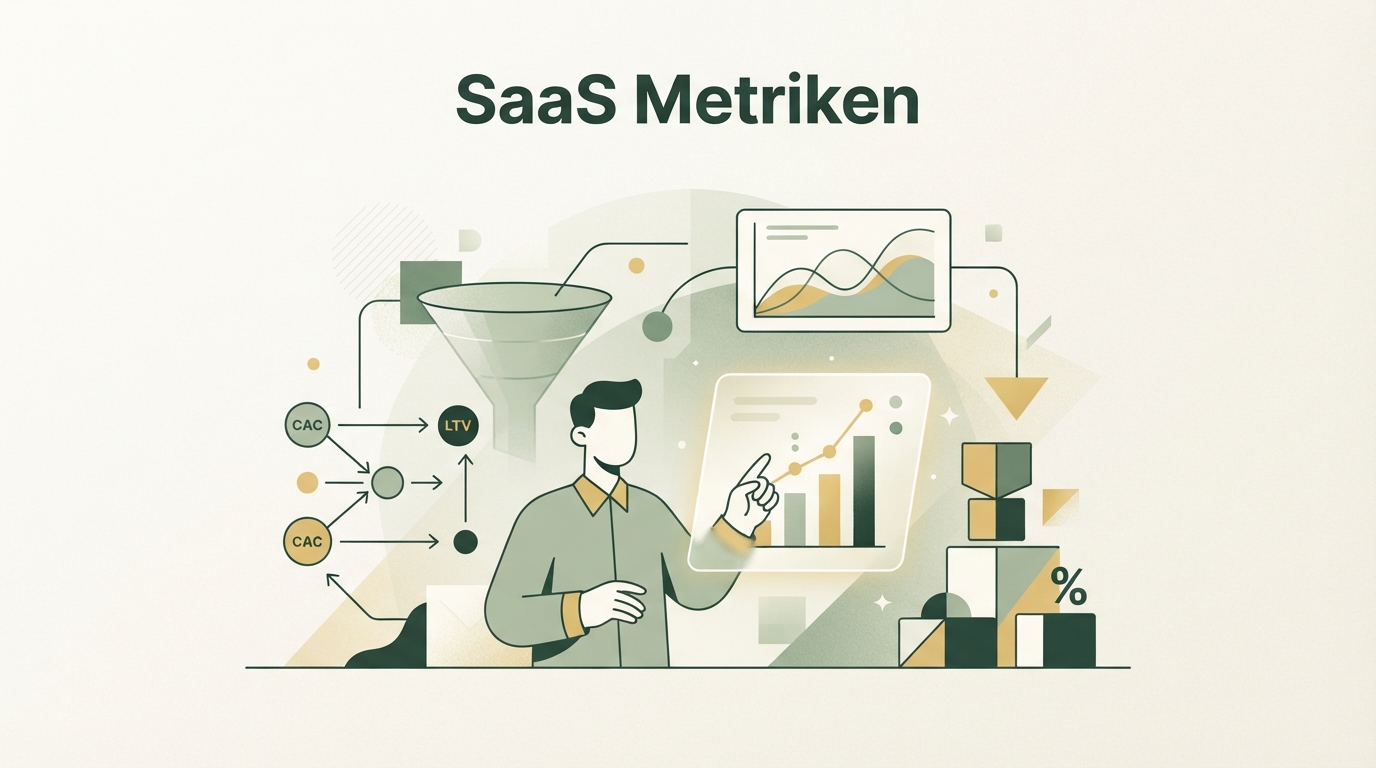
A SaaS metric measures whether your business is growing sustainably. SaaS metrics boil down to four building blocks that actually matter: MRR/ARR, churn, LTV/CAC, and Net Revenue Retention. Plenty of founders check their MRR every single day, even though that number barely budges month to month when you only have a handful of customers — yet they check their churn rate just once a quarter, even though that's the number that decides life or death in year one.
I've done this myself. In the early months I was staring at revenue and completely missed that more customers were leaving out the back than were coming in the front.
The problem: most dashboards show you ten numbers, and none of them tell you what to actually do tomorrow. So here's an attempt to set the record straight — which metrics really matter, how to calculate them, and where the classic thinking traps are.
MRR and ARR: the basics that still get miscalculated all the time
These four metrics matter most because they keep each other in check — none of them is enough on its own. MRR (Monthly Recurring Revenue) is your recurring revenue per month; ARR (Annual Recurring Revenue) is simply MRR times twelve. Simple enough. The mistake happens elsewhere: a lot of people lump in one-time payments, setup fees, or discounted months, then wonder why their MRR bounces around like a blood pressure reading.
Calculated properly, MRR breaks down into several components:
- New MRR: revenue from new customers
- Expansion MRR: upgrades from existing customers
- Contraction MRR: downgrades
- Churned MRR: revenue from customers who canceled
Track these four numbers separately instead of just the total, and you'll immediately see whether your growth is coming from new customers or whether you're just scaling up existing ones while people keep dropping out the bottom. That's a massive difference when it comes to how stable your business really is.
One point that often gets overlooked: ARR is a projection, not a fact. It's saying "if everything stays exactly as it is next month, you'd earn X over a year." For a business with high churn, that projection deserves a healthy dose of skepticism. I've seen pitch decks present ARR like it's cash sitting in the bank. It isn't.
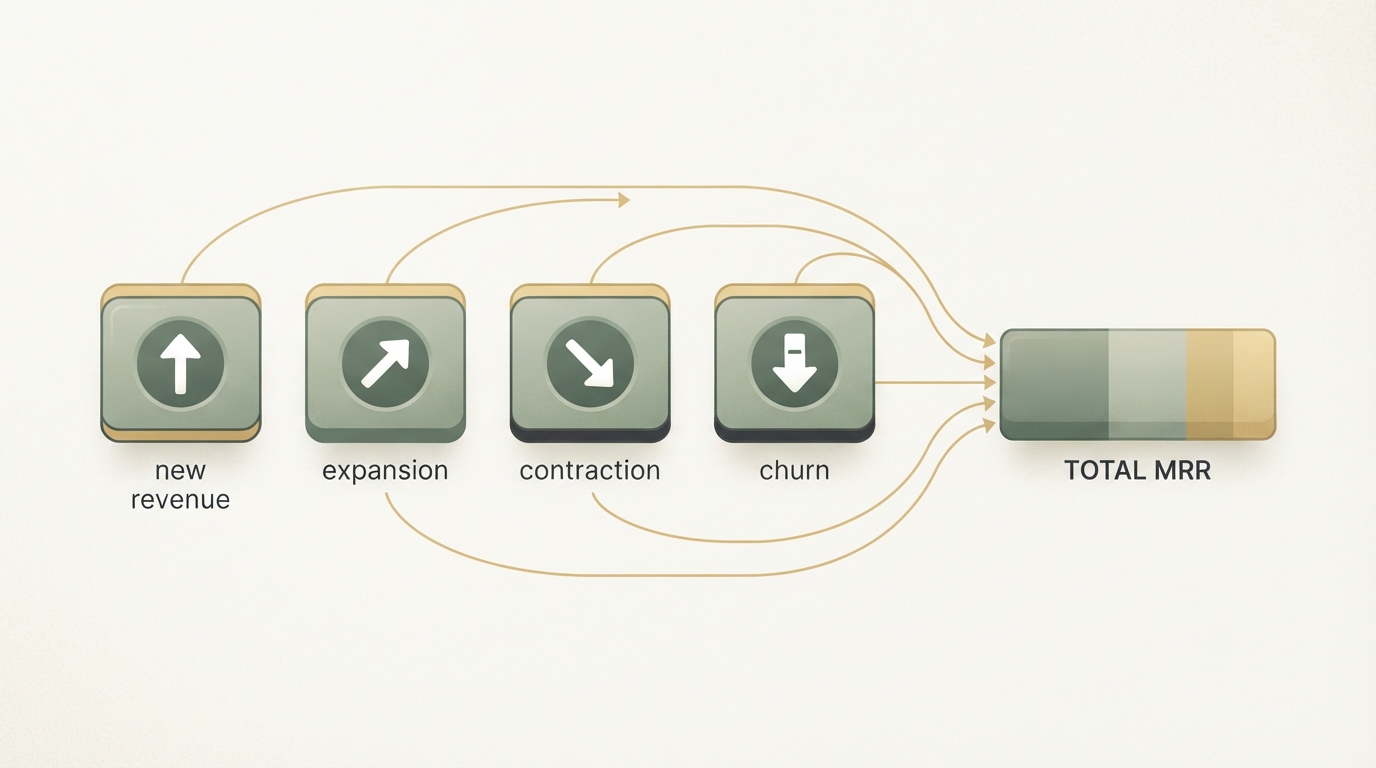
Fig. 1: How MRR breaks down into four components.
Churn rate: the number that hurts the most
Churn rate shows what percentage of your customers or revenue you lose over a given period. There are two variants, and the difference matters more than it sounds: customer churn (how many customers leave) and revenue churn (how much revenue leaves).
Here's an example that shows this well: you have 100 customers, 5 cancel. Customer churn sits at 5%. But if those 5 customers were only on your cheapest plan, and at the same time three big customers upgrade, your revenue churn could actually be negative — meaning you end up earning more overall even though customers left. That's called net negative churn, and it's one of the strongest indicators of a healthy SaaS business there is.
As a rough rule of thumb — and really just a rough one, since it varies a lot by industry and customer size — B2B SaaS with larger customers often sees 1–2% monthly customer churn as solid. For lower-priced B2C tools, 5–7% isn't unusual either. What matters isn't the absolute number but the trend over time and how it compares to similar providers in your niche.
Churn early in the customer lifecycle — the first 30–90 days — usually has different causes than churn after a year. A lot of people miss this. Early cancellations often point to an onboarding problem, meaning users aren't grasping your product's value fast enough. Late cancellations tend to be more about price, missing features, or a better competing offer. Lump both together and you'll end up solving the wrong problem.
If you're still working on your pricing model, by the way, it's worth checking out SaaS Pricing: The Mistake Almost Everyone Makes — a lot of churn starts with pricing, not the product.
LTV/CAC: the ratio that decides whether your business scales
The LTV to CAC ratio shows you whether you're making more money from a customer than it costs to acquire them — with enough buffer to grow profitably. LTV (Lifetime Value) is the estimated total revenue a customer brings over the entire relationship with you. CAC (Customer Acquisition Cost) is the cost of winning a new customer, i.e., marketing and sales spend divided by the number of new customers.
The rule of thumb often cited in the industry: an LTV/CAC ratio of 3:1 is considered a healthy benchmark. Below 1:1, you're losing money on every customer. Above 5:1, it might even mean you're investing too cautiously and could actually grow faster by putting more into marketing. These are rough guidelines, not guarantees — every business works differently.
Here's roughly how to calculate LTV:
LTV = (average revenue per customer per month) × (average customer lifetime in months)
Customer lifetime depends directly on your churn rate: at 5% monthly churn, the average lifetime is about 20 months (1 divided by 0.05). Drop your churn to 2%, and lifetime jumps to 50 months. See how tightly churn rate and LTV are linked? A small improvement in cancellation rate has a massive effect on lifetime value.
CAC often gets set too low because people only count ad spend and forget salaries, tools, or the time spent writing content. Calculate it realistically, or you're just lying to yourself.
| Metric | What it shows | Typical target (rough guideline, not a rule) |
|---|---|---|
| MRR/ARR | Recurring revenue | Steady month-over-month growth |
| Churn rate | Customer loss per period | 1–2% B2B, 5–7% B2C (rough) |
| LTV/CAC | Profitability per customer | roughly 3:1 or higher |
| CAC payback | Months to recoup CAC | often targeted under 12 months |
The SaaS metrics that stay in the shadows
Beyond MRR, churn, and LTV/CAC, there are a few metrics that get mentioned less often but often reveal more about a business's health. Take CAC payback period: it shows how many months it takes to recoup a customer's acquisition cost. The shorter, the less cash you need to grow.
Want to know what percentage of new users reach the point where they actually experience your product's core value? That's your activation rate. A project management tool might define that as "created a first project with at least three tasks." If that number is low, you can pour in all the traffic you want — it still won't work, because people bail before they get there.
And then there's Net Revenue Retention (NRR): the revenue from existing customers compared to the previous year, including upgrades and minus cancellations. Values above 100% mean your existing customer base alone is growing, even without a single new customer. According to publicly available benchmarks, many of the best SaaS companies worldwide hit somewhere between 110% and 130%. That's one reason investors often look more closely at NRR than at raw revenue growth for B2B SaaS.
How to actually read your metrics instead of just collecting them
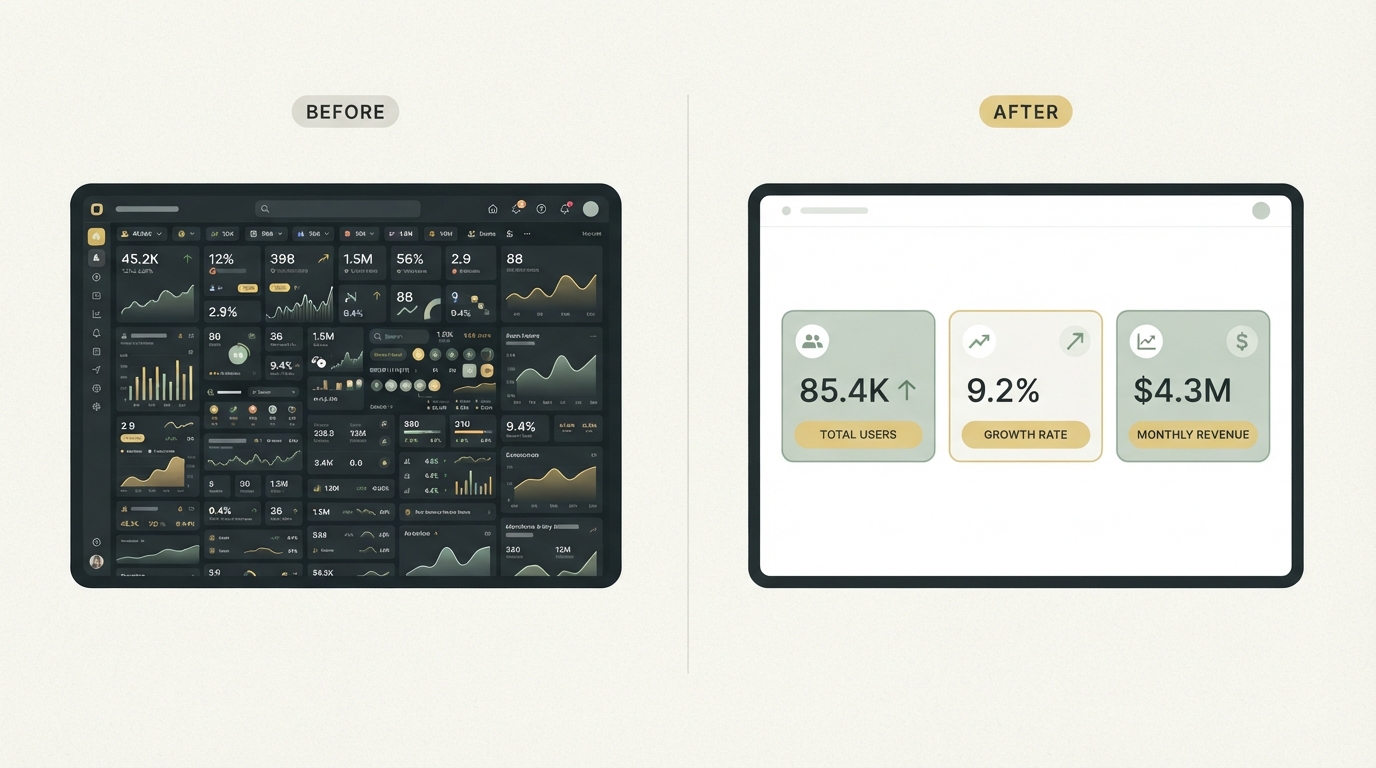
Numbers without context are worthless. A dashboard full of metrics does nothing for you if you don't know which three of them actually determine success or failure right now.
A practical approach worth trying: build a simple weekly ritual. Don't look at 20 numbers — look at exactly three: MRR growth, churn rate, and LTV/CAC. Log them in a simple table, the same row every week. After eight to twelve weeks, you'll spot patterns you'd never catch looking at a single month in isolation.
A concept that fits well here is Paul Graham's idea from "Do Things That Don't Scale": early on, what matters isn't the perfect dashboard, it's whether you actually understand what's happening with each individual customer. With 10 or 20 customers, you can still ask each one why they churned. With 500 customers, you need systems for that. Don't confuse the two phases.
If you're still at the very beginning and just building your product, it's worth checking out Building an MVP: The Mistake Almost Every Founder Makes — because the metrics described here only start making sense once real users are paying real money.
What these metrics can look like for real SaaS products
Looking at real products helps build a feel for order of magnitude, even though the specific numbers here are just estimates from our research database, not official company figures.
Diode, for instance, sits at roughly $5M in estimated MRR according to our estimates, with a growing trend, at around 142,000 monthly visits. The ratio of traffic to estimated revenue gives a rough hint at either comparatively high conversion or a very high-priced B2B market — both would fit a hardware-adjacent niche product.
Snaptrade shows an estimated similar picture: roughly $4.4M in estimated MRR with comparable traffic. As an API infrastructure product for fintechs, it likely has different churn dynamics than a typical end-user tool — API customers tend to switch less often because migration is technically a heavier lift. This illustrates something important: churn rate depends heavily on the business model, and you should always read benchmarks in the context of your own category, not across industries.
You can explore exactly these kinds of comparisons, traffic estimates, and revenue trends for real SaaS products yourself in Starte.ai's Trend Finder research, before defining the metrics you want to measure yourself against.
Common mistakes with SaaS metrics
The most common mistake is confusing vanity metrics with real metrics. Sign-ups, website visitors, or social media followers feel good, but say little about the health of your business. A trial sign-up is not a metric to hang your growth on — a paying, active customer is.
Second mistake: looking at metrics in isolation. MRR growth looks great until you realize churn rate is climbing just as fast. LTV/CAC looks amazing until you realize your CAC is only low because you're barely spending on marketing and therefore barely growing. Every metric needs at least one counter-metric to put it in context.
Third mistake, and this one's almost human nature: only looking at the numbers that currently look good. If your MRR is growing but your churn rate is exploding at the same time, it's easy to miss because the one number glowing green on the dashboard is the one you notice. That's why I'd always recommend deliberately looking at the num """
Frequently asked
Was ist eine gute SaaS Metrik, um Wachstum zu messen?
MRR (Monthly Recurring Revenue) und ARR sind die Basis, weil sie deinen wiederkehrenden Umsatz zeigen. Wichtig ist aber, dass du New, Expansion, Contraction und Churned MRR getrennt trackst, sonst siehst du nicht, ob dein Wachstum wirklich von neuen Kunden kommt oder du nur bestehende Kunden hochskalierst, während unten Leute abspringen.
Was ist ein guter LTV/CAC-Wert?
Ein Verhältnis von 3:1 gilt in der Branche oft als gesunder Richtwert. Unter 1:1 verbrennst du mit jedem Kunden Geld, über 5:1 investierst du eventuell zu vorsichtig und könntest schneller wachsen. Das sind grobe Orientierungswerte, keine Garantie, jedes Geschäft tickt anders.
Was ist eine gute Churn Rate für SaaS?
Bei B2B-SaaS mit größeren Kunden gelten oft 1–2% monatliche Kundenchurn als solide, bei günstigen B2C-Tools sind auch 5–7% nicht ungewöhnlich. Wichtiger als die absolute Zahl ist aber der Trend über Zeit und der Vergleich mit ähnlichen Anbietern in deiner Nische.
Was ist Net Revenue Retention (NRR)?
NRR vergleicht den Umsatz deiner bestehenden Kunden mit dem Vorjahr, inklusive Upgrades und abzüglich Kündigungen. Werte über 100% bedeuten, dass dein Kundenstamm allein schon wächst, auch ohne einen einzigen Neukunden. Die besten SaaS-Unternehmen erreichen laut öffentlich verfügbaren Benchmarks geschätzt Werte zwischen 110% und 130%.
Written by
Bohdan BernatekFounder, Starte.ai
Founder of Starte.ai. Built a business to 125,000+ organic leads and seven-figure revenue — and now works with founders personally, deriving a strategy for their own brand from data across thousands of real projects and producing the creatives for it.